Portland Timbers II Edges Minnesota United II in Thrilling 2–1 Clash
The lights had barely cooled at Providence Park when the numbers began to tell their own story. In a tight MLS Next Pro Group Stage contest, Portland Timbers II edged Minnesota United II 2–1, a result that did more than just tilt the night in the home side’s favour. It sharpened the outlines of who these teams are becoming in the 2026 season, and where their tactical ceilings might lie.
I. The Big Picture: Two volatile contenders
Heading into this game, Portland Timbers II were one of the league’s great contradictions. The standings table has them on 17 points from 9 matches, with a goal difference of 1 (13 scored, 12 conceded overall in the standings snapshot, 14 scored and 15 conceded in the broader season stats). Either way, they are a side that lives on the edge: five wins, no draws, four defeats. At home they had played 6, winning 3 and losing 3, scoring 10 and conceding 10 in total, with identical home averages of 1.7 goals scored and 1.7 conceded per game.
Minnesota United II arrived with a similarly sharp profile. In total this campaign they had played 10, winning 5 and losing 5, with 11 goals for and 13 against for a goal difference of -2 in the broader stats, and -3 in the standings snapshot (10 scored, 13 conceded). On their travels they had already played 7 times, winning 3 and losing 4, scoring 9 and conceding 11, averaging 1.3 goals for and 1.6 against away.
This was not a clash of solidity versus chaos; it was chaos meeting chaos, with both sides leaning into risk rather than retreating from it.
II. Tactical Voids and Disciplinary Undercurrents
There was no explicit injury or suspension list available, but the lineups themselves hinted at where each coach saw vulnerability.
For Portland, Jack Cassidy named a young, aggressive XI: S. Joseph, A. Bamford, N. Lund, C. Ondo, C. Ferguson, E. Izoita, V. Enriquez, B. Barjolo, L. Fernandez-Kim, C. Griffith and D. Cervantes. It is a group that fits the statistical profile: a team that presses and plays forward even if it leaves the back door ajar. In total this campaign they had kept 3 clean sheets (1 at home, 2 away) but also conceded 15 overall, a sign of a side that defends in moments rather than in structure.
Their disciplinary pattern reinforces that impression. Across the season, Portland’s yellow cards are heavily clustered between 61–75 minutes, where 31.82% of their cautions arrive, and then again from 76–90 minutes at 18.18%. This late-game surge of cards suggests a team that often has to scramble defensively once the game stretches, either to protect a lead or chase a result. There are no red cards recorded in any interval, which points to controlled aggression rather than outright recklessness.
Minnesota United II’s starting group – K. Rizvanovich, P. Tarnue, A. Kabia, N. Dang, J. Farris, M. Harwood, L. Pechota, S. Vigilante, K. Michel, M. Caldeira and D. Randell – looked more balanced on paper, but their season discipline numbers tell of a side that gets dragged into battles at key phases. Their yellow cards spike between 31–45 minutes (27.78%) and again from 76–90 minutes (another 27.78%), with 22.22% in the 61–75 window. The pattern is clear: Minnesota tend to pick up bookings when matches are about to tilt – just before half-time and in the decisive closing quarter.
III. Key Matchups: Hunter vs Shield, Engine Room vs Enforcer
The “Hunter vs Shield” narrative is less about a single star and more about collective behaviour.
For Portland, the notional “hunter” is the attacking unit led by C. Griffith, who appears across the league’s top lists for goals, assists, and cards – a statistical quirk that underlines his centrality rather than his output. Around him, the likes of B. Barjolo and D. Cervantes form a front line that thrives in open games. At home, Portland’s attack is productive enough: 10 goals in 6 home fixtures, averaging 1.7 per game.
Their opposite number is Minnesota’s away defence, which has conceded 11 goals in 7 away matches, at an average of 1.6 per game. The minute distribution of goals conceded is telling: 30.77% of their goals against come between 31–45 minutes, and 23.08% between 46–60 minutes. That mid-game wobble dovetails dangerously with Portland’s tendency to sustain pressure through the middle of matches and then ride out the storm with late cards.
On the flip side, Minnesota’s “hunter” is their late-game attack. In total this campaign, 30.00% of their goals arrive between 76–90 minutes, with another 20.00% between 61–75. They are built to surge late, especially away where their 1.3 goals per game are often clustered in transitions as opponents tire.
The shield facing that surge is a Portland defence that does not have a detailed minute distribution recorded, but whose card pattern suggests strain in exactly those moments. With 31.82% of their yellows between 61–75 and 18.18% between 76–90, they often defend on the edge when Minnesota are at their most dangerous.
In the “Engine Room” duel, Minnesota’s midfield of M. Harwood and L. Pechota has to manage that balance between control and verticality. Their team’s total average of 1.1 goals for and 1.3 against reflects a narrow margins side, one that tries to keep games within a single goal. Portland’s central axis – with E. Izoita and V. Enriquez providing legs and aggression – is less concerned with control and more with acceleration. The home side’s season form line of WWLLWLWLW shows how frequently matches involving them break out of tactical order.
IV. Statistical Prognosis: Edges, not certainties
Following this result, the shape of these squads is clearer. Portland Timbers II remain a high-variance, high-ceiling outfit. In total this campaign they score 1.6 goals per game and concede 1.7, yet their penalty record is perfect: 2 taken, 2 scored, 0 missed. When they create high-value chances, they tend to convert.
Minnesota United II, with their single penalty of the season converted and none missed, mirror that composure from the spot but lack Portland’s volume. Their under/over profile is stark: in total this campaign they have gone over 1.5 goals just 2 times out of 10, and over 2.5 only once. They live in low-scoring margins, hoping their late-game surge (30.00% of goals in the final 15 minutes) can tilt tight contests.
In an xG-informed lens, Portland’s higher scoring averages and willingness to trade chances suggest they will consistently generate more expected goals than they allow, but their defensive looseness will keep opponents in games. Minnesota’s structure and away record – 3 wins and 4 losses on their travels – point to a team that can steal points if the match stays in the 0.7–1.3 xG band on both sides.
The tactical preview, then, is less about predicting comfortable wins and more about forecasting volatility. When Portland host, expect a game that stretches, especially through the middle third and into the final quarter, with yellow cards and decisive actions clustered between 61–90 minutes. Minnesota’s best path remains to keep the game tight early, survive Portland’s mid-game surges, and then unleash their late attacking pattern where 50.00% of their goals in total come from 61–90 minutes.
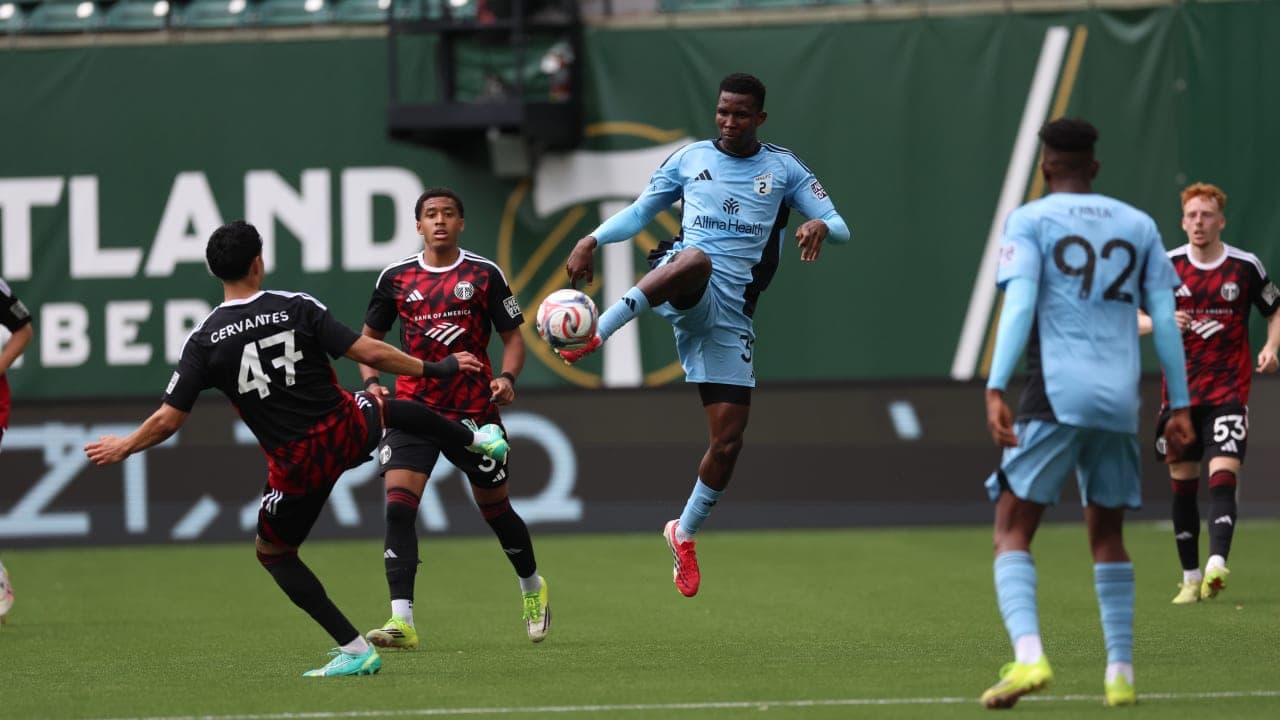
In this meeting at Providence Park, Portland rode their attacking edge and home volatility to a 2–1 win. Going forward, both squads look set to remain what they already are: dangerous, imperfect, and must-watch in every single round.